As a consultant for telcos and ISPs who do VoIP, nearly all of my customers have network diagrams. We use these diagrams when we make network design changes or troubleshoot an existing network.
However, nearly any time we study a customer's network diagram in detail, they'll say, "Wait, that's not right. This doesn't even show the FL-2100 we installed two years ago!" Or, "No, there must be more cables than this. There's no way this is right."
While I still learn important things from every customer's diagram, having an accurate network diagram can help streamline project management and issue resolution. That's why learning to create network diagrams effectively can be very useful for anyone who builds and manages VoIP networks.
In this blog, I'll break down the different types of network designs and what you need to know to draw an effective network diagram.
What Are Network Diagrams?
A network diagram is a graphical representation that depicts the architecture of a network; but you knew that. But when done well, a diagram is a language, like English, or C# or Python. It very clearly and carefully describes a communications network. It's a visual language, yes, but just like English, it's not random in any way.
Network diagrams are important tools for engineering teams since they provide us with a way to understand the network that fits into our heads. The two most common categories network diagram types are physical diagrams, which shows the physical relationship between the components of a network, and logical, which shows how connecting devices in a network communicate with each other.
- Physical: Shows the physical relationship between networking devices and components.
- Logical: Shows how devices in a network communicate with each other.
Types of Physical Layer Diagrams
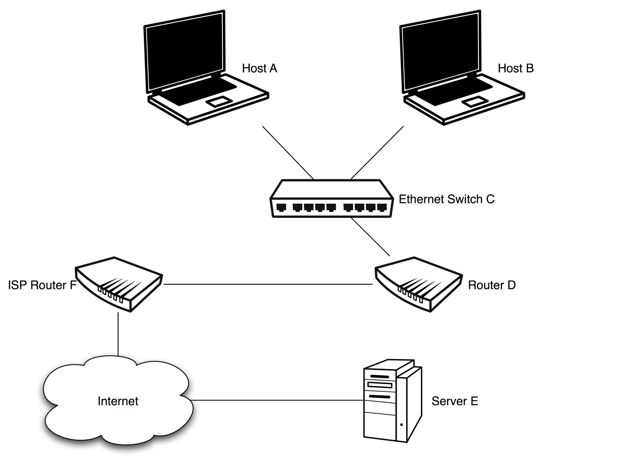
Nearly everyone who builds and manages VoIP networks maintains physical layer diagrams, where each box symbol on the network diagram represents a physical device component, and each line represents a cable.
Physical diagrams can help with troubleshooting wholesale outages, counting available ports, or designing fault tolerance. And they're fine for 1994-era IP networking – all hubs, no VLANs, and only one IP address per device.
However, physical diagrams strain to convey:
- VLANs: Which VLAN is this port assigned to? Is it a VLAN trunk?
- Subnets: What subnet is this device a member of?
- Roles: Which network components are doing routing? Switching? Basic servers?
- IP routing tables per device: Such as Cisco VRFs / MPLS VPNs.
- Devices with multiple IP addresses within each stack: Visio users tend to insert pictures of the equipment, but it's often distracting and doesn't print well.
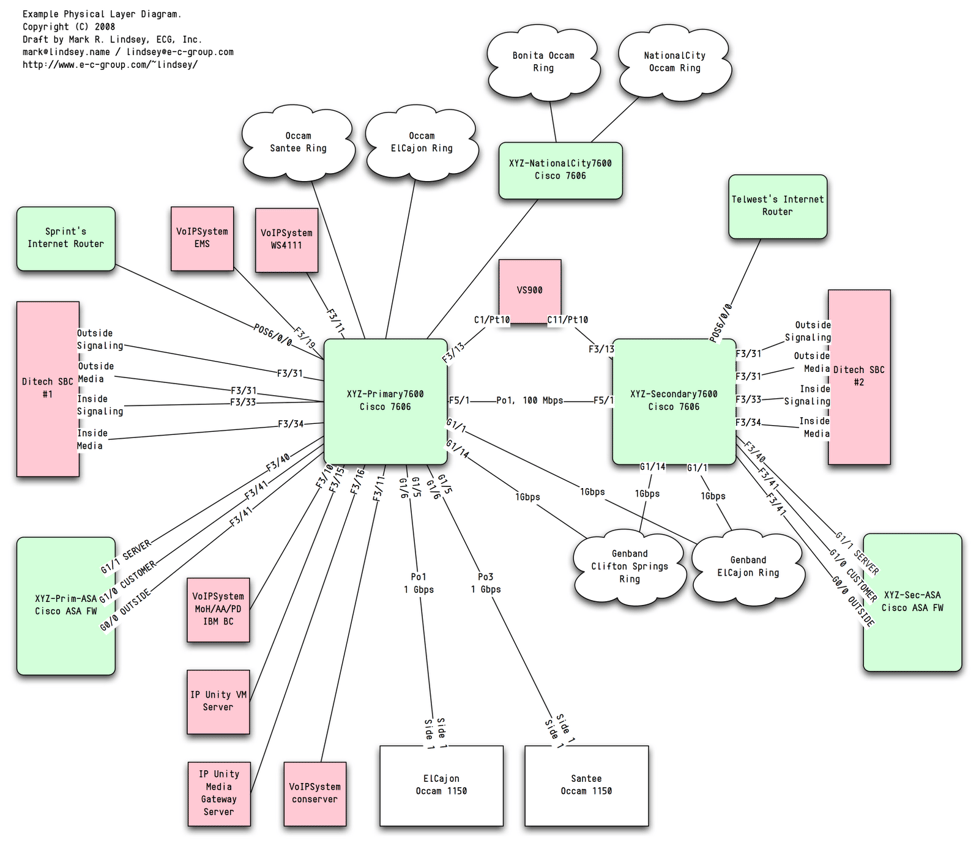
Here's an example of a physical layer network diagram:
VLAN/Subnet Diagrams
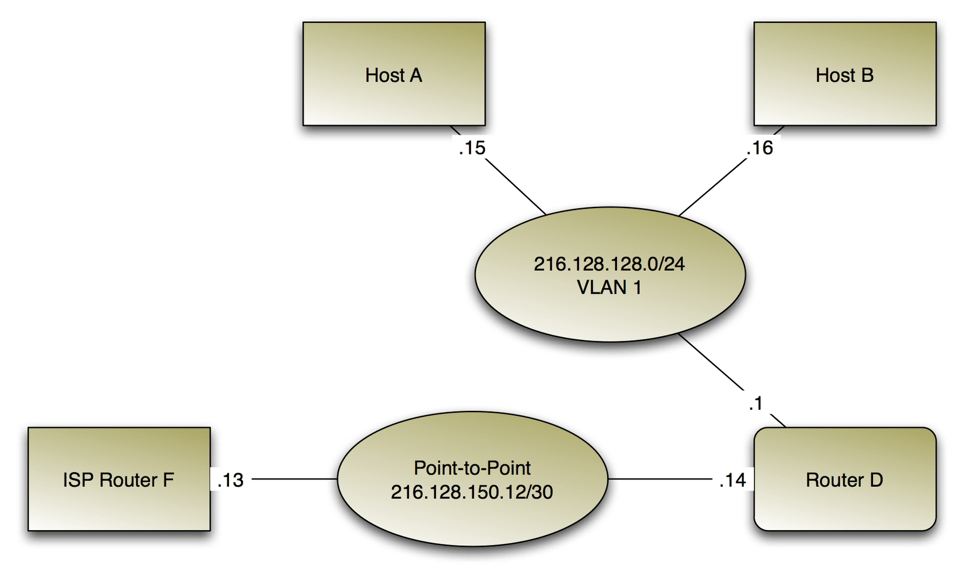
A VLAN/Subnet diagram is when each box represents a VRF or IP routing table – typically one per physical device. Every line represents an IP address assignment to a subnet. At the center, another shape, like an oval, represents the actual subnets or collision domains. In clean designs, one subnet is exactly one VLAN, and layer-2 switching equipment typically isn't drawn in.
VLAN/Subnet diagrams are ideal for following the paths of packets through the network. However, they have their limitations, too:
- They can't represent layer-2 redundancy.
- They aren't good at identifying available ports.
- Not every physical device is shown, so they aren't good for inventory.
- They don't show what data flow is normal or expected.
When VRFs are involved, an alternate approach is to create a network diagram that represents VLANs with color-coded cables. A blue cable is VLAN 101, a red cable is VLAN 102, and a green cable is VLAN 103. This method can be effective as long as you only have a small number of VLANs; otherwise, you might end up asking, "Which VLAN is magenta...and which is purple?"
Application-Layer Communication Diagrams
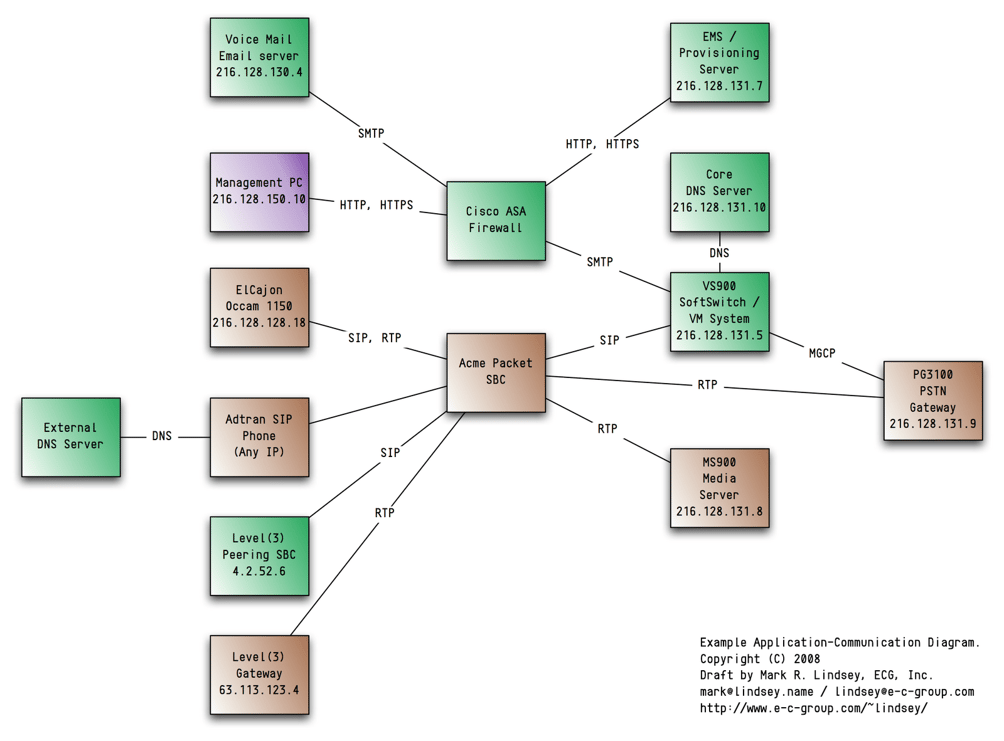
Another valuable abstraction for diagramming networks is called an application-layer communication diagram. This type of network diagram doesn't show any underlying transport but only the normal communication paths at the application layer. For any given device, there are connecting lines to every other device it communicates with at the application layer.
Application-layer communication diagrams are essential for developing effective firewall and IDS rules. They're also valuable for SIP VoIP platforms, where routing of SIP messages is complex and where it's reasonable to ask, "Where should this device be sending its INVITE? To what other devices will it be sending RTP?"
An example of an application-layer communication network diagram is below:

Step-by-Step Guide to Drawing a Network Diagram
Drawing a network diagram requires detailed knowledge of the network's architecture and every device involved. Here's a step-by-step guide to help you draw a basic network diagram:
- Identify and list each device in your network: This can include servers, routers, switches, hubs, and endpoints like workstations and laptops.
- Decide on which topology to use for your network: The topology could be bus, star, tree, ring, or mesh, as discussed above. The topology you choose will shape how your devices are interconnected.
- Draw the main components first: Start by plotting the central devices like switches, servers, or routers that act as your network's principal hubs or backbones.
- Connect the devices: Once the main components are in place, draw lines representing the connections between each device.
- Add endpoints: Now, you can add endpoints like workstations and laptops and connect them to the main device.
- Label all devices and connection points: Clearly label each device, connection, and relevant symbols. This can include information like device names, IP addresses, and the type of connection.
- Review and update: Ensure that all network devices are included and accurately interconnected. Regular updates of the diagram are necessary to reflect changes within the network.
Remember that the goal of creating a network diagram is to visually represent your network's structure. Diagramming software can also assist in simplifying the design and updating processes of complex diagrams.
Learn How To Draw a Network Diagram With Expert Guidance From ECG
If you're struggling to draw network diagrams, we're here to help. Drawing an effective network diagram takes a lot of in-depth experience in designing and managing different network architectures.
Working with a voice engineering consultant like ECG can help you get the expertise needed to create a network diagram that represents your complex systems. We have years of proven experience building and supporting voice networks for dozens of VoIP service providers in the U.S. and worldwide, so you can trust our engineering team to deliver elegant network designs or provide the training your staff needs to draw a network diagram better.
Ready to create more accurate diagrams for your network upgrade and expansion projects? Get in touch with ECG today.